Automatic Powerline Classification
Automatic Powerline Classification is found in the Classification section of the  Automatic Point Cloud Analysis tool.
|
|
This tool requires Global Mapper Pro |
The Powerline Classification option in the Automatic Point Cloud Analysis tool can automatically detect power lines in high density lidar data. This density is typical of terrestrial lidar, mobile lidar, or uav collected lidar point clouds. Photogrammetric point clouds, such as those generated using Pixels to Points, may also have this density, but they do not typically have the reconstruction detail to precisely identify powerlines. There are two methods for powerline classification in Global Mapper Pro:
- Grid is the traditional method and was designed for aerial, fixed wing collected lidar. It classifies points based on their geometric relationship to a best fit plane. This is the method best for aerial lidar with multiple returns in forested areas.
- Max Likelihood uses segmentation, and is developed to work with more modern point clouds such as terrestrial lidar, programmatic, and drone-mounted. The Segmentation Method segments the point cloud into clusters of points, and then determines if those clusters are likely powerline points.
You can choose to run multiple classifications at once by checking multiple options (noise, ground, etc). They will run in a pre-specified order based on method.
Use the settings in the top of the Automatic Point Cloud Analysis window to choose which layers are to be operated on, filter or limit processing, change custom segmentation settings for Max Likelihood, and more.
Once your settings have been determined for all desired classifications, click Classify Features to begin processing.
Classification and Extraction Shared Settings:
Power Line classification shares two settings with the Feature Extraction tool:
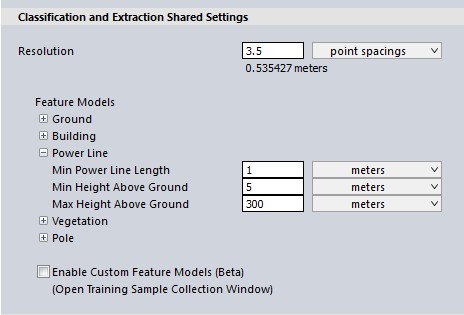
Minimum Powerline Length
Sections of powerline that are shorter than this set length will be ignored. Increase this value when using low density point clouds.
Minimum and Maximum Height Above Ground options
Use these fields to specify the minimum and maximum height above ground that a point has to be in order to consider it as a possible powerline point.
Powerline Classification Methods:
The point cloud should have ground points already classified prior to performing this classification. Global Mapper will do this automatically when the ground classification option is also selected to run simultaneously.
The Grid Method
The powerline classification algorithm for the Grid method compares segments of data (bins) to best fit lines, to classify points as powerline that are within a minimum distance from a best-fit line. It recommended to run this data on point clouds with at least 20 points /m2.
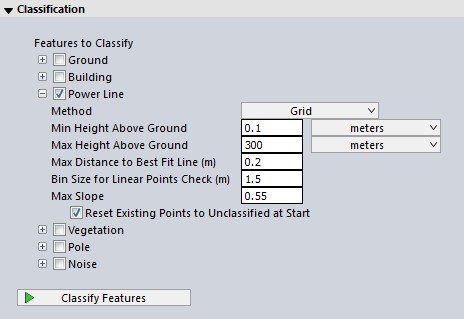
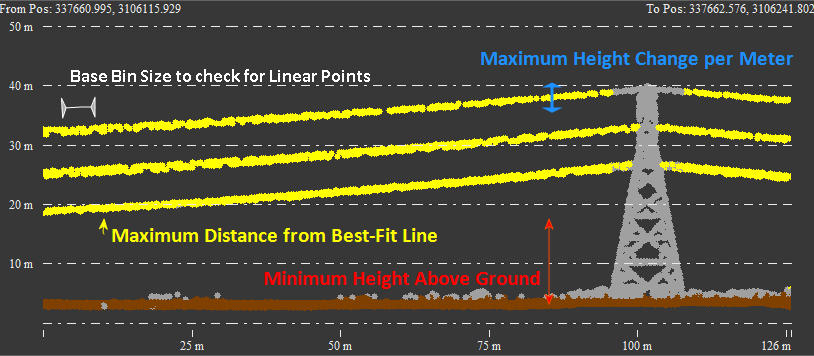
Maximum Distance from Best Fit Line
The algorithm works by creating a "best fit" line where it estimates the power line to be, then compares the points to the line. This setting determines the maximum distance (in meters) away from the best-fit 3D line of points with similar elevations in a bin, that any points can be and still be considered powerlines.
Bin Size to Check for Linear Points
This setting controls the size of each bin (meters per edge) when evaluating points to see if they follow a linear pattern. Overwrites shared resolution setting.
Maximum Slope (Height Change per Meter)
Use this field to specify the maximum difference in elevation allowed per meter to consider points as possibly part of the same powerline segment. Basically, it measures the amount of slack in the powerline. The default value is 0.5m, which allows for a change in elevation of 0.5m over a 1m distance between points. You might wish to specify a slightly larger value if your data is noisy.
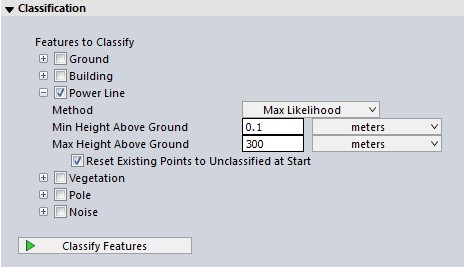
The Max Likelihood Method
The classification of powerline points involves a statistical analysis (Principal Component Analysis) of clusters of nearby points to determine what is likely part of a powerline feature. Points are gathered into clusters based on a measure of similarity between nearby points, with the intent to group points that belong to the same object or feature. Segments are classified by evaluating the likelihood that they have a statistical distribution matching the powerline fingerprint. Segments with linearity less than what is expected from a base powerline fingerprint are rejected.
- To train the algorithm for your specific feature, check the box to enable Custom Feature Models. These settings will influence how the point cloud is classified.
Once your settings have been determined for all desired classifications, click Classify Features to begin processing.
Additional Options
Enable Report
Enable this option to see a report of the classification results and to save the classification settings as a .json file for future use or to share with other users. The Enable Report option generates a report that summarizes the settings used and the results of a classification method. The report is generated as a text file in a Reports folder at the specified location.
To load the saved settings .json file: Open the automated Point Cloud Analysis tool, check the box to Enable Custom Feature Models, then from the list of options that appear, choose Load Models.
Reset Existing Pole Points to Unclassified at Start
Resets the classified pole point data to unclassified at the beginning of processing.