Pixels to Points Processing Report
Separate from the log file, the Post Processing Report is designed to efficiently summarize the outputs from the Pixels to Points tool in a way that is easily digestible.
The Post Processing Report is generated at the completion of the Pixels to Points tool processing. It will automatically open in your default web browser and can be saved as a PDF document. If the Log option has been set, the file will save in that location as Filename_report.html.
Note: Timings and memory usage statistics for each step in the process can be found in a separate text report found in a folder on your machine after processing:
C:\Users\yourName\AppData\Local\Temp\2\GlobalMapper\P2P
Locate your output folder to find the p2p_stats.txt file inside. This output is only produced when Pixels to Points is run from the main tool, not the wizard.
Summary
The Summary chart shows basic information about the dataset and output. Some of this information is read from the metadata saved by the UAV when the image was taken, including Image Collection Date, Camera Make, and Flight Altitude. Other information is calculated during processing, including: Processing Date and Time, Approx. Ground Spacing, Image Count, Image Pixel Count, Coverage Area, Fit Error Mean and Max, Projection, and Vertical Datum.
For information on Projection and Datum, see Output Files.
Overview
The Overview section shows images of each generated output, and notes the camera positions and information used for each image in the data set.
The Point Cloud Section shows the total number of points in the cloud, and the point density in the form of Average Point Spacing. The point cloud will display based on the draw mode currently set for lidar in Global mapper. The default color for an unclassified point cloud is gray.
The Orthoimage Section shows the full image, and the orthoimage’s resolution.
The 3D Model Section shows the 2D, nadir perspective of the 3D Mesh along with its Vertex Count, and Face Count.
Face and Vertex delineation is visible in Global Mapper when zoomed in but is omitted in this report for clarity.
The Camera Positions section shows camera icon at the center location of each image relative to the orthoimage to make it easier to visualize area coverage. Areas with a higher image coverage will typically have a lower chance of errors. Images that were unable to be used in the Pixels to Points process will be shown with a red X symbol.
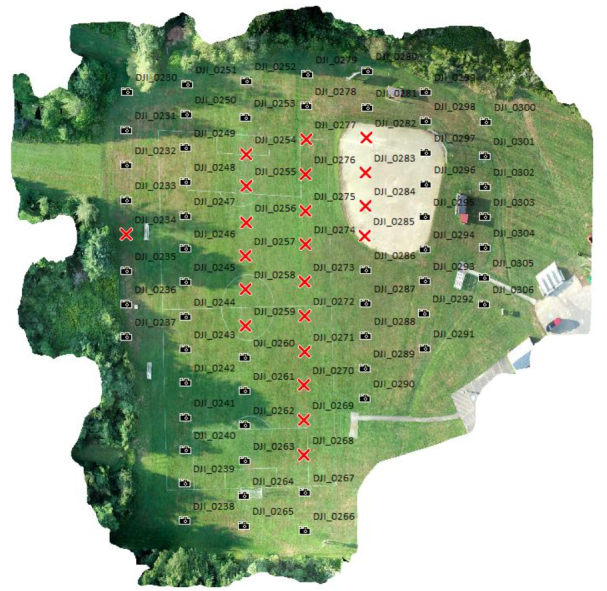
The Camera Positions chart shows the image name, and specifics on where the image was taken including Elevation, Roll, Pitch. and Yaw. This chart makes it easy to compare image metadata for quality control purposes. Images unable to be used in the process are listed at the bottom of the Camera Positions table.
Quality Assessment
The first section under Quality assessment is a table containing Overlap Statistics.
-
Coverage Ratio - This is how well the generated Bounding Box matches the area that the image covers. It's the amount of the area (bounding box) covered by at least one image. It is covered area divided by total area.
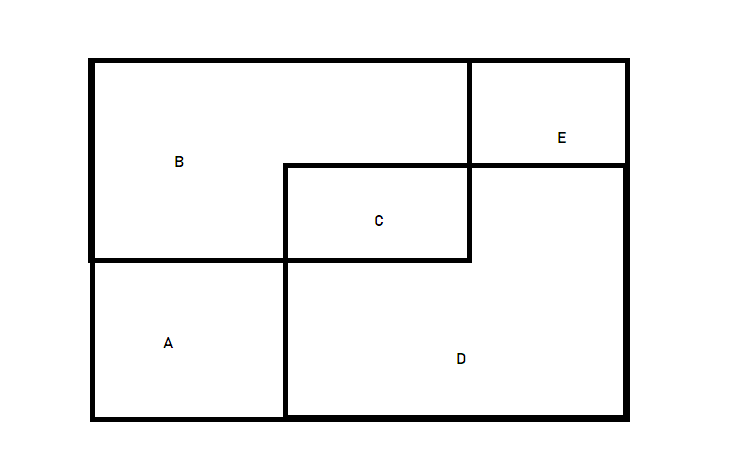 In this example, B and D are overlapping images within a bounding box. C is the overlapping area. The coverage ratio would be calculated with (B+C+D) / (A+B+C+D+E).
 -
Overlap Ratio – The amount of area (estimated by a bounding box) that is covered by at least 2 images, divided by total area. This value may be low if your images aren’t in a rectangular pattern.
-
Average Area Calculation Error- To save processing time, the area of overlap is calculated approximately. Average Area Calculation Error is the estimated error of those approximations. An 1% error means the result was 101 instead 100. If the error is high, try generating the footprints again after the Pixels to Points reconstruction process.
-
Forward Overlap - The number of images that have overlap in the forward flight direction. The forward direction is defined by timestamps of the images.
-
Forward Disconnect - A count of non-overlapping images in the forward flight direction. The forward direction is defined by timestamps of the images.
-
Side Overlap - The number of images that have side overlap. The "side" direction is about 90 degrees bearing to the flight direction.
The second section is a graphic showing the Ground Coverage Polygons.
The third section is a Quality Assessment chart that breaks down processing success image by image. This includes the number of observations, or object points, in each photo that pixels to points was able to find in other photos. The residuals are the distance between where Pixels to Points thinks a point should be, and where it ended up. Residuals are largely proportionate to the number of errors.
Images that were unable to be used in the process are listed at the bottom of the Quality Assessment Chart.
Processing Settings
The Processing describe the Pixels to Points tool settings used in the process. These include:
Method: See Analysis Method
Quality: See Quality
Camera: See Camera Type
Image Reduce Factor: See Reduce Image Size