Adding Custom Online Sources
Use the Add New Source button from the File menu within the Connect to Online Data tool to add new online sources from WMS (Web Map Service), WCS (Web Coverage Service), OSM (OpenStreetMap Tiles), Google Maps-organized tiles, TMS (Tile Map Service), Esri RESTful Feature Services, or Esri RESTful tile caches.
Note: If the source highlighted in the list matches the source type specified in the Select Online Source Type dialog, the values from that source will automatically populate in the Tile Source Definition or Select Data Source dialog.
Steps to add Custom Online Data Sources:
1. To add custom online source, you will need:
- The source URL
- Type (see step 4 for list of supported types)
- (Optional) the zoom level/extent of the source.
2. In the Connect to Online Data tool, from the File menu, press the Add New Source... button.

3. Select the Source Type and press OK.

4. Required input information will differ based on chosen Source Type.
Select the Source Type below for specific instructions:
5. Click Get Available Service Layers to query the server and populate the data control with the available data layers on that server.
6. Select a layer, or layer group, and click OK.
7. In the next dialog, specify the source name and category. See Organizing Sources for more information.
8. Now that the source has been added, it will be available in the Custom, and in All Sources tabs.
a. Optional: In the Custom tab, right click on the new source and choose Select Online Source Preview to import a JPG image, 200 x 200 pixels, with EXIF position information to use as the preview image.
Source Types and Related Instructions:
The Online Data Tool supports:
WMS/ WCS / WFS / WMTS
If the WMS, WCS, WFS or WMTS options are selected, then the
Select WMS Data Source to Load dialog (pictured below) is displayed.
This dialog allows the user to specify the URL of a data source
and select what layer(s) to add as an available data source on the Select
Online Data Source to Download dialog.
- Input the Server URL (also sometimes called theGet Capabilities Address) .
- Once the URL has been entered, press the Get List of Available Data Layers button to query the server and populate the data control with the available data layers on that server.
- Select the desired data layer or group from the list.
- Once a layer is selected, the Projection and Image Format drop-downs will populate with the available projections and formats for the layer(s). To customize the format or projection, select it from the list.
- Alternately, to force the use of the JPG format, specify a Service Name parameter of 'WMS&format=image/jpeg' in the Service Name field. To force a particular projection that the server supports to be used, include a SRS parameter, like 'WMS&SRS=EPSG:26905' to force the use of the UTM projection with the NAD83 datum and zone 5N.)
- (Optional) To specify additional options for the WMS server,
add those parameters
after the Service Name parameter.
- For WMS v1.1 support, select the option to 'Prefer WMS 1.1.1 Over Newer Versions'. If not selected the default is v1.3.
- Select the data layer and style and press OK to add it to the available data source list.
- Now that the source has been added, it will be available in the Custom tab, and in All Sources.
Examples for WMS/ WCS / WFS / WMTS
WMS
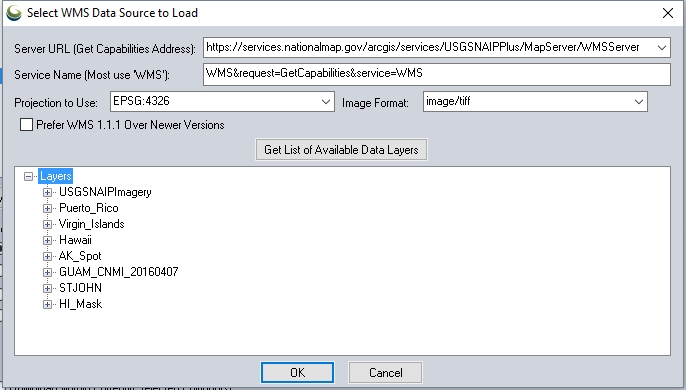
Below is an example WMS connection that connection to the USGS National Map NAIP Plus data. Note the full Get Capabilities url was placed in the server URL field. The tool will separate the URL once the Get List of Available Data Layers button is pressed.
WCS
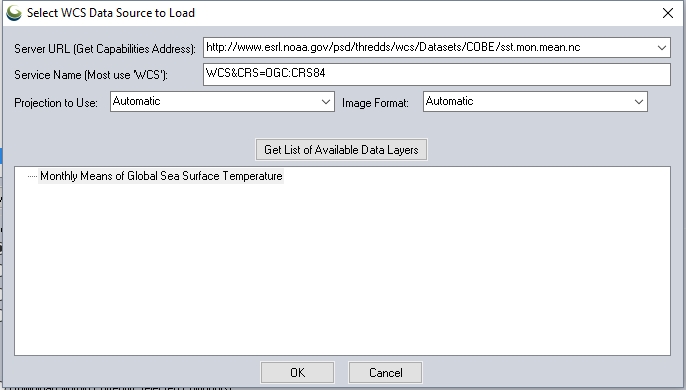
Below is an example adding NOAA Sea Surface Temperature data as a WCS. Note the Get Capabilities is omitted from the WCS server url. This service also explicitly sets the CRS.
When connecting to a WCS service, an additional dialog will display to further specify the download request. Specify the File Format, and other applicable values.
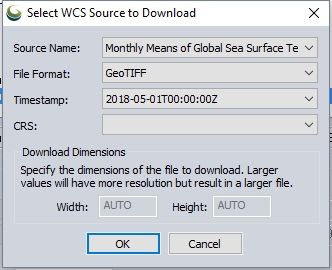
Then enter a file to store the downloaded data. This file will load automatically load into the application once downloaded.
WFS
This example downloads geology data from the British Geological Survey
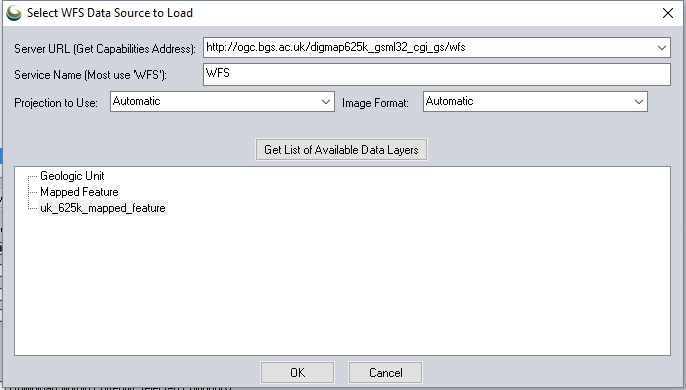
When connecting to this source, a dialog will appear to save the GML file. This file will load automatically into the application once downloaded.
WMTS
The below example connects to a NASA WMTS source for Tree Cover.
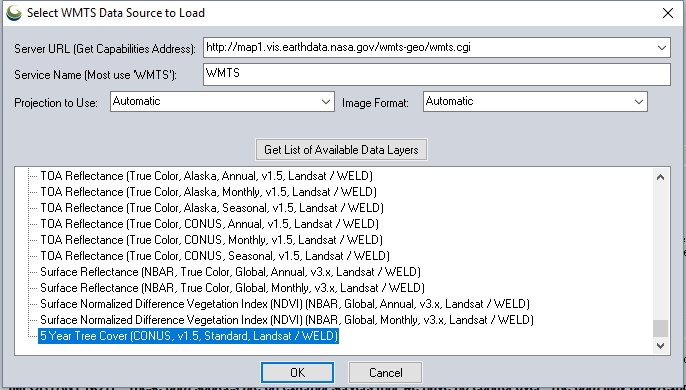
This particular source also has an additional dimensions value that may be specified:

Maximum Zoom
To set a
maximum zoom level, right-click on the added WMS layer in the list of
sources and set a maximum zoom level (in meters per pixel) for the layer.
Example
You can specify a maximum zoom level of 5.0 meters per pixel, so when loading data from the source, no tiles with a resolution greater than 5.0 meters per pixel will be downloaded. This is useful for sources that don't specify themselves what the maximum resolution should be and just go blank when you over zoom them.
ESRI RESTful Feature Service
ESRI RESTful Feature Service only supports vector data. To add a REST feature data source, in the Online Data Tool:
- Click File > Add New Source..., then
- Choose Esri RESTful Feature Service from the list of source types.
The Select Esri RESTful Service to Load dialog will then be displayed:
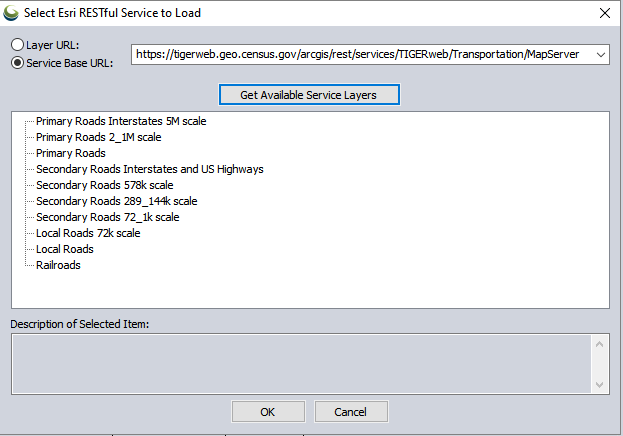
- Then, connect to a REST Feature Service either by pointing to a specific layer url, and pressing OK, or by entering the root folder of a service url.
Layer URL
A Layer URL points directly to a specific data layer. A Layer URL must, at a minimum, include all parts or the service URL up to the Layer ID (an integer value indicating the index of a layer within a service URL). It can also be the full URL copied from a REST service API list. For example, a layer url can typically be copied from an online catalog of ESRI REST datasets as the GeoService API in the list of APIs.
A layer would generally follow one of these schema:
<server_url>/arcgis/rest/services/<folder>/...../MapServer/<layer id>
<server_url>/arcgis/rest/services/<folder>/...../MapServer/<layer id>/query?....
Service Base Url
A Service Base url would follow one of these general schema:
<server_url>/arcgis/rest/services/<folder>/...../MapServer
<server_url>/arcgis/rest/services/
The base URL must contain the service URL up to "services" or a folder name. TClick the Get List of Available Layers button once the Service Based Url is entered to download information from the server.
If the URL ends with "services", then the tree view will be populated with available folder names. Click a folder name to get additional information about the services in the selected folder.
If the URL ends with a folder name, the tree will be populated with the services contained in the folder. Clicking on a service name will show the layers that are available via the service.
Once the layers are displayed, select one layer or service and click OK. If a service with multiple sub-layers is selected, all of the layers in the service will be added to the online source list.
ESRI RESTful/Google Maps Tiles , OSM (Open Street Map Tiles), TMS (Tile Map Service Tiles), MVT (MapBox Vector Tiles)
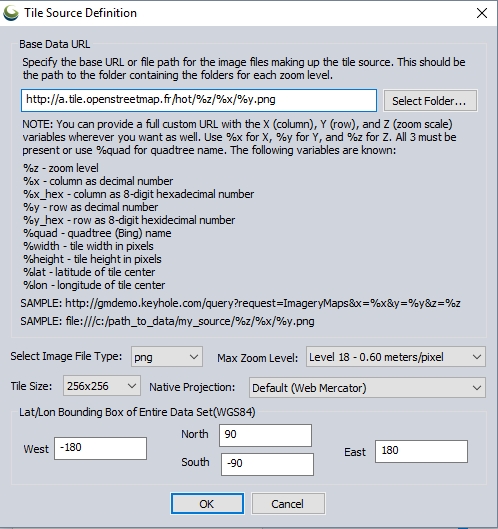
If OSM, Google Maps, or TMS source type is chosen, then the Tile Source Definition dialog (pictured below) is displayed.
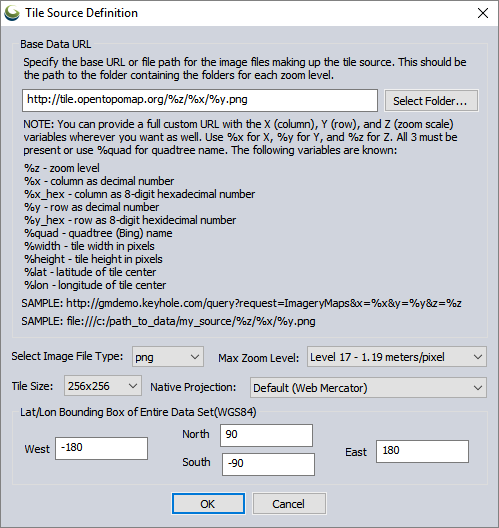
The Base Data URL is the URL where the data for the tiled source can be found, including variables that point to the tile end points based on the tiling scheme.
The path to the image endpoint can be specified in the Base Data URL field using the following variables:
- %z- zoom level
- %x - column as decimal number
- %x_hex - column as 8-digit hexadecimal number
- %y - row as hexidecimal number
- %quad - quadtree (Bing) name
- %width - tile width in pixels
- %height - tile height in pixels
- %lat - latitude of tile center
- %lon - longitude of tile center
A URL with variables named %x (column), %y (row), and %z (zoom scale) in
the URL can also be used, so that the URL can be setup however the data
source requires, rather than using the default expected URL setup.
If accessing a source setup similar to Bing Maps tiles, it might be necessary to use the quadtree filename. Use %quad to do this. This replaces the %x, %y, and %z values. Finally the Bing Maps RESTful services supports accessing via the zoom scale (%z) and a latitude and longitude value in the tile. Use %lat and %lon to include the latitude and longitude of the center point of the tile in your custom URL.
If a MapBox Vector Tile service is being accessed, the source will stream tiles of vector data in PBF ot MVT format into Global Mapper. The Tile Size field specifying a raster tile size in pixels is not applicable for this source type and cannot be selected.
Image File Type
It will be necessary to specify if the source uses PNG or JPG image files .
Max Zoom Level
Provide the maximum zoom level to use when loading the source.
Tile Size
Specify the size of the tiles in pixels. This will be included in <TileSize> in the xml file.
Native Projection
Specify the projection used for the tiles.
Lat/Long Bounding Box
Specify the bounds of the data source in degrees latitude longitude.
Examples:
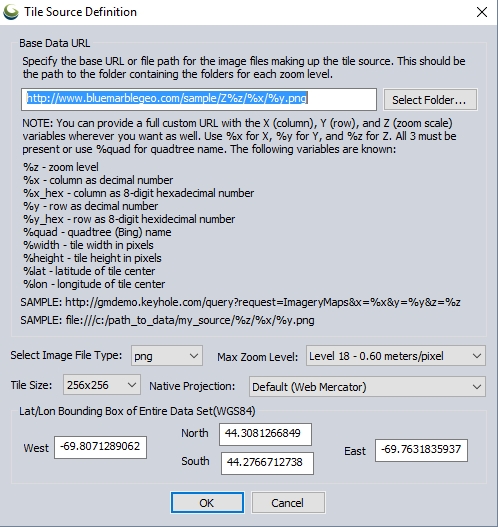
Google Maps
Below is an example of a connection to a Google Maps tiled source exported from Global Mapper and placed on a web server.
ESRI REST services
Global Mapper can connect to ESRI REST MapServers that have cached map tiles. For more information see ESRI API
A typical ESRI Rest tile server follow this format: https:// <mapservice-url>/tile/<level>/<row>/<column>
In Global Mapper, this would translate to a url such as this:
https://sampleserver.com/ArcGIS/rest/services/MapServer/tile/%z/%x/%y.png
OSM / TMS
The below example connects to the Humanitarian Open Street Map tile server.
EPT (Entwine) Lidar Tiles
Entwine Point Tiles (EPT) provide a method to stream tiles of lidar data into Global Mapper. If the EPT (Entwine) Lidar Tiles option is selected, the Enter URL dialog (pictured below) will display prompting the user to enter the URL of the JSON definition for the source.
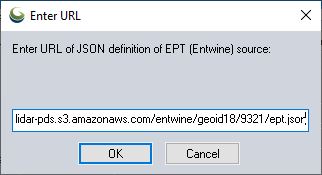
After entering the URL, the source can be organized and added to the list of built in online sources. When connecting to an EPT source, the user will be prompted to select a Cloud Connection to access the source. Previously used Cloud Connection accounts will be remembered and available from a dropdown list, or users can add a new one with the required credentials.
Organizing Sources
The Edit Online Source dialog allows you to specify where in the All Sources tab the new source will be located. If no category is chosen, the source will be added to the bottom of the list. Once added, Custom data sources are also available from the Custom tab.
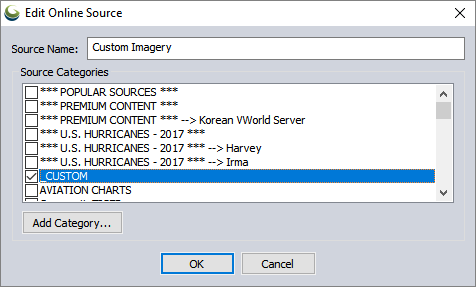
When adding a new source:
- Specify the Source Name in the field at the top.
- To add it to an existing Source Category, check the box next to the category.
- Press the Add Category... button to add a new group.
- Nested categories /groups can be created in the source list by adding '
--> ' in the Category name.
Nested Category Example:
To add a new category named "Maine" within the existing category "U.S. Data", name the new category:
'U.S. DATA --> Maine'
This will create a nested source group that will appear as such in the final dialog:
- U.S.
DATA
- Maine
- Source
Name
- Source
Name
- Maine
- U.S.
DATA
- Nested categories /groups can be created in the source list by adding '
--> ' in the Category name.
- Once a source is added:
Troubleshooting
When no tile data is visible once connected to the source, use the option in the Control Center right-click context menu to Draw Boundaries of Missing Online Layer Tiles to display outlines and labels of the tiles.